The previous post finished with the observation that, since the sum of all Equity is zero, and the banking sector must be in positive equity, part of the remainder of the economy—the government, or the non-bank public—must be in negative equity. So which sector is better equipped to handle that: the non-bank public, or the government?
This will raise the age-old question that is perennially thrown at those who advocate government spending: “How are you going to pay for it?”, or “Where’s the money going to come from?”. To answer both these questions, we first need to know how money is created in general.
Since money, exclusively in this model and primarily in the real world, is the sum of the Banking Sector’s Liabilities and Equity, any action which increases Bank Liabilities and Equity creates money. Since every transaction is recorded twice, operations which increase the money supply must therefore occur on both the Assets and the Liabilities/Equity sides of the banking sector’s ledger. Operations which occur exclusively on either the Assets side, or the Liabilities/Equity side, shift money between accounts and do not create money.
So the answer to the “where’s the money going to come from?” question is “from any operation which increases the Assets and Liabilities/Equity of the banking sector”. Equally, any operation that reduces Assets and Liabilities/Equity destroys money.
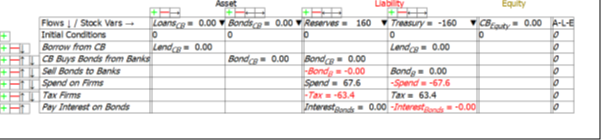
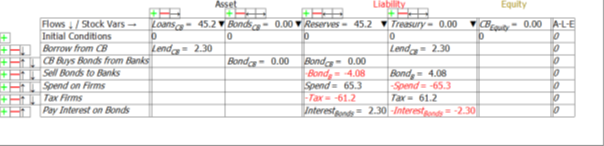
Only 5 of the 13 flows in this model affect both the Asset and Liabilities/Equity sides of the banking sector’s ledger: Lending (and Repayment); Government spending (and Taxation); and interest payments on Treasury Bonds. These are shown in the top 5 rows of Figure 1. All other operations are either Liability/Equity swaps, or Asset swaps, and they don’t create money.
Figure 1: The Banking Sector’s Ledger
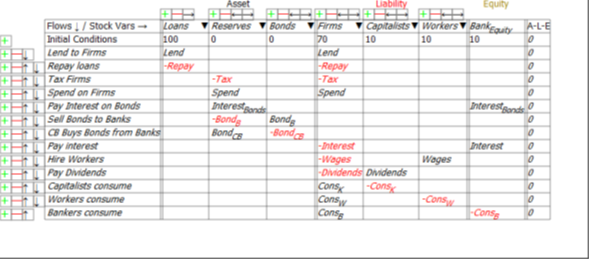
Operations that don’t create money include the usual suspects—payment of interest on loans by firms (which transfers money from the Firm Sector to the Banking Sector), purchases of goods from the Firm Sector by workers, capitalists and bankers. But they also include two operations that figure large in conventional arguments about how to pay for government spending: sales of Treasury Bonds to the finance sector; and purchases of Treasury Bonds from the finance sector by the Central Bank in “Open Market Operations” (which are primarily used to control the rate of interest). Neither of these operations create money.
They are asset swaps: the sale of Treasury Bonds to the finance sector (the “Banking Sector” in this model) reduces Reserves and increases the Banking Sector’s stock of Treasury Bonds. The purchase of Treasury Bonds from the Banking Sector by the Central Bank reduces the Banking Sector’s stock of Treasury Bonds and increases the Banking Sector’s Reserves. Neither operation affects the amount of money in the economy—the sum of the Liabilities plus Equity of the Banking Sector.
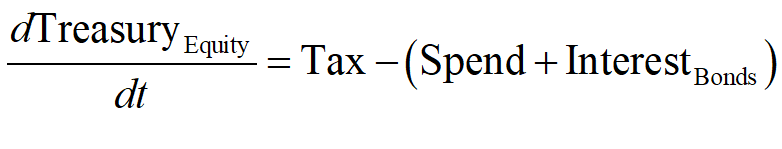
Since it’s an asset swap for the Banking sector to buy Treasury Bonds using Reserves, the answer to “where’s the money going to come from?” is “from operations that increase the sum of Reserves and Bonds”. You can work this out by adding up the entries in the Reserves and Bonds columns of Figure 1: the Banking sector assets Reserves plus Bonds will grow if government spending plus interest payments on Treasury Bonds exceed taxation:
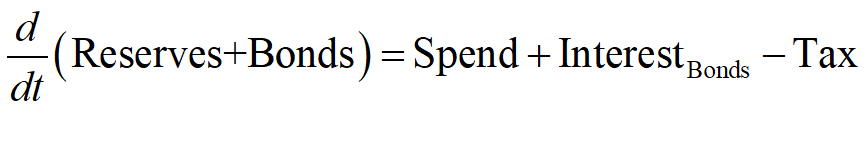
The Reserves that are used to buy the Bonds thus come from the deficit itself. The deficit—the extent to which government spending and interest payments exceeds taxation—creates money in private sector bank accounts (the Firm Sector and Bank Equity only in this model). This boosts the Liabilities and Equity of the Banking Sector. The corresponding Asset that is increased by the deficit is the Reserve accounts of the banking sector. If no interest is paid on Reserves—the “usual” situation, and sometimes made worse by charging negative interest on Reserves in the false belief that this will encourage Banks to lend more—then the Banks have a positive incentive to use these reserves to buy Treasury Bonds instead.
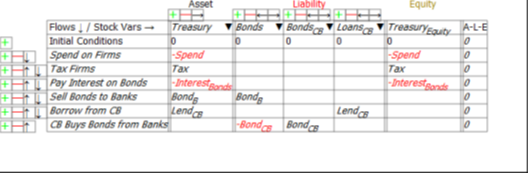
So the answer to the “Where’s the money going to come from?” to pay for the deficit question is that it comes from the deficit itself: the deficit creates money that can be spent in the private sector; and it creates Reserves, which are (usually) non-interest earning Assets of the Banking Sector that are liabilities of the Central Bank—see Figure 2.
Figure 2: The Central Bank’s Ledger
Reserves are Assets of the Banking Sector that earn it no income. But if the Treasury issues bonds to cover the deficit—if the total value of Treasury Bonds offered for sale is equal to the deficit itself—then the Banking Sector is offered a deal to swap a non-income-earning asset for an income-earning one.
What do you think the banks would do, when offered that deal? They take it, of course: this is why Treasury Bond Auctions have always been over-subscribed. Selling the bonds themselves is not a problem. It is, as Kelton emphasises in The Deficit Myth, a “no brainer” swap of a zero-income-asset for a positive-income-asset.
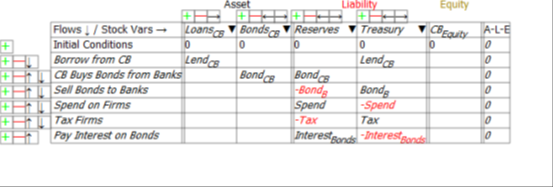
The money needed to buy the bonds has already been created, and is sitting in the Reserve account. Banks then transfer their funds from one Asset that earns no income (Reserves) to another Asset that does (Treasury Bonds). This Asset is a liability, not of the Central Bank, but of the Treasury itself—see Figure 3.
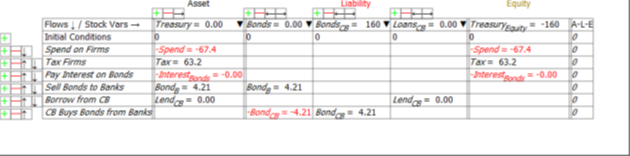
Figure 3: The Treasury’s Ledger
This table also shows that the increase in Reserves is caused by the fall in the Government’s equity: Reserves (and hence money) rise if the Government runs a deficit; Reserves and money fall if the Government runs a surplus:
How does the Treasury pay the interest on the bonds? The same way it pays for spending in excess of taxation: it runs up its own negative equity—see the final column in Figure 3.
This can be done in two ways, as indeed can overall deficit-financing itself: by the Treasury having a negative balance in its account at the Central Bank; or if the Treasury borrows from the Central Bank to pay Interest on the Bonds (the second last row of Figure 3). If it does so, the negative equity from paying interest on the bonds remains, but the Treasury Account at the Central Bank can be kept non-negative.
A third option is that the Central Bank buys the bonds off the Banking Sector in Open Market Operations (or QE). If it does so, the amount of interest the Treasury needs to pay falls. Also, since the Treasury is the effective owner of the Central Bank, it doesn’t need to pay interest to the Central Bank on its holdings of Treasury Bonds—or if it does, the interest payments come back to the Treasury in Central Bank profits.
So the Government can run a deficit, and pay interest on the Treasury Bonds issued to cover it (not finance it: the deficit is self-financing in that it creates money), so long as it is willing to countenance being in negative equity. As noted in the previous post, because Banks must be in positive equity, the non-Banking sectors (and that includes the Government) must be in negative equity. For the Government to achieve positive equity therefore—which seems desirable, if you take the partial view of the economy epitomised by Representative Hern’s motion that “deficits are unsustainable, irresponsible, and dangerous”—the non-Bank private sector must be pushed into even greater negative equity.
Does that sound like a good idea?
To show the consequences for the economy of the government running a deficit or a surplus, it’s necessary to go beyond the purely structural equations used so far, and enable simulations. In what follows, I’ve built an extremely simple model of monetary dynamics in which all expenditures depend on the amounts of money in relevant bank accounts. There are many other ways these expenditures could be modelled, but this way ensures fairly easily that crazy outcomes—like workers have negative bank balances, but still spending their wages—don’t happen in this very simple model.
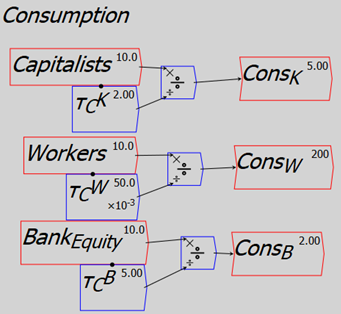
For example, I relate consumption by workers to the level of workers deposit accounts at the private banks, using the engineering concept of a “time constant”. This is a number that tells you how long an action would take to run an account down to zero, if it’s removing money from the account, or to double it, if it’s adding money to an account. A time constant of 0.02 for workers consumption says that if workers consumed at a constant rate of there were no other inflows or outflows in their accounts, then they would run their accounts down to zero in 1/50th of a year—roughly a week. Higher values for capitalists and bankers—say 2 for capitalists and 5 for bankers—assert that it would take 2 years and 5 years respectively for them to run their accounts down to zero through consumption alone.
You divide the relevant stock (the level of bank accounts, in the case of consumption) by the time constant to get the annual flow—see Figure 4.
Figure 4: Equations for consumption
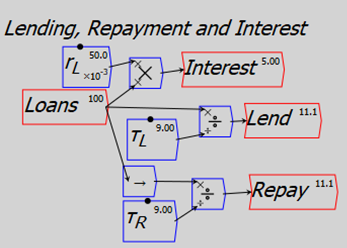
Similarly, a time constant of 9 for bank lending says that if this was the only inflow affecting the level of debt, and it went on at a constant rate, debt would double in 9 years. Repayment with the same time constant means that the level of (private) debt remains constant.
Figure 5: Modelling interest payments, lending and repayment
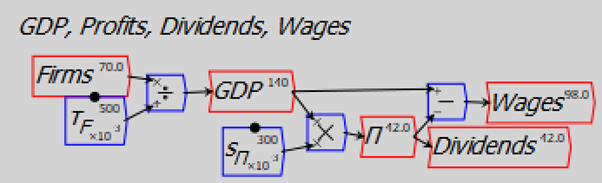
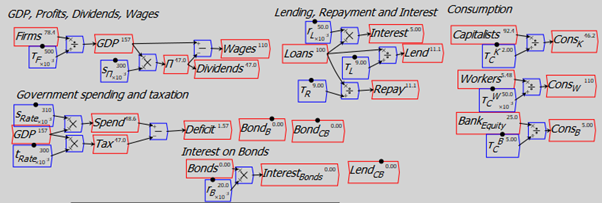
GDP is treated as the turnover of money in the firm sector (it can also be treated as the sums of consumption and investment—which investment is entirely debt-financed in this model—and net government spending, but that makes it possible to end up with negative sums in deposit accounts, unless a much more complicated model is constructed).
Figure 6: Modelling GDP and income distribution
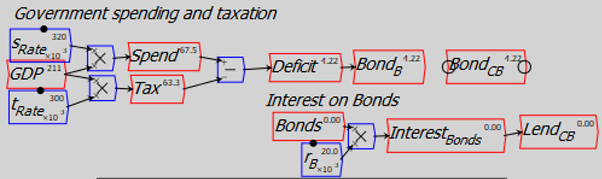
Government spending and taxation are treated as simple percentages of GDP. For the moment, I have not considered how they are financed, so the flows BondsB, BondsCB and InterestBonds are not wired up. The equations that define the system’s flows at this point are shown in Figure 7. At this stage, sales of Treasury Bonds to the Banking Sector, Central Bank purchases of Bonds from the Banks, and Treasury borrowing from the Central Bank, are not defined.
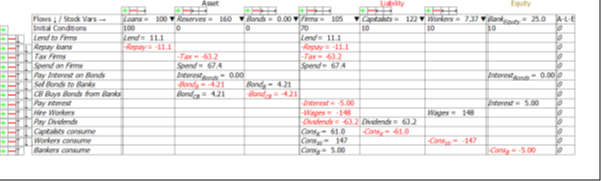
Figure 7: All the flow equations in the model (without bond sales or interest on bonds)
With no explicit financing of a government deficit, the negative equity that this causes for the government turns up as a negative balance in the Treasury’s account at the Central Bank—see Figure 8, which shows the impact of a 2% of GDP deficit for 60 years on the Treasury. It runs accumulates negative equity of $160, and that is entirely due to its account at the Central Bank being negative to the tune of $160.
Figure 8: The Treasury’s Ledger with no bond sales: negative Treasury Account and Treasury Equity

Figure 9 shows the impact of a 2% of GDP deficit for 60 years from the Central Bank’s perspective, and the key point is that the negative equity of the Treasury is the same magnitude as the positive Reserves of the Banking Sector: the accumulated deficits of the Government are precisely equal to the accumulated Reserves of the Banking Sector.
Figure 9: The Central Bank’s Ledger with no Bond sales: negative Treasury precisely equals positive Reserves
How does the picture change if we require that the Treasury’s account at the Central Bank can’t go into overdraft? Then the Treasury has to sell Bonds equal to its Deficit, and borrow from the Central Bank to pay interest on those bonds.
Figure 10: Bond sales are equal to the deficit, no Central Bank purchases of Bonds from the Banking Sector
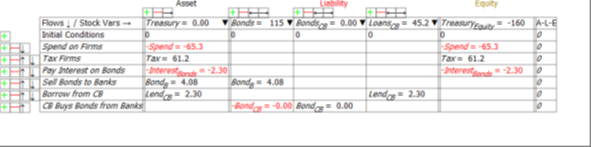
Running this model to the same point as the previous one, where the Treasury Equity reaches minus $160, this negative equity consists of $115 in Bonds and $45.2 in Loans from the Central Bank (see Figure 11; the Treasury account at the Central Bank remains at zero). The Bond sales represent the accumulated government deficit over time, while the Loans from the Central Bank represent the accumulated interest on those bonds.
Figure 11: Treasury books with Bond sales covering the deficit
Can the Central Bank afford to lend the money to pay the interest on Treasury Bonds to the Treasury? Yes: as Figure 12 shows, the loans to the Treasury are an Asset of the Central Bank. It has the capacity to expand its balance sheet indefinitely, and none of the operations shown in this model affect its equity at all.
Figure 12: Central Bank books with Bond sales and interest payments on Bonds
I have to note that this was a surprise to me: I had guessed that the government’s negative equity would be carried by the Central Bank, and the fact that a Central Bank—unlike a private one—can operate with negative equity {Bholat, 2016 #6037} would be what enabled the government as a whole to sustain negative equity. But it turned out that my guess was wrong: the Central Bank simply acts as an enabler of and conduit for the Treasury’s negative equity.
Does the fact that the Treasury is borrowing from the Central Bank (in this model) cause any difficulty? No, because while private individuals can’t pay interest on loans by borrowing from banks—without that interest ballooning with further interest and driving us bankrupt—the Treasury can pay interest on Bonds to the Banking Sector by borrowing from the Central Bank because, technically and legally, the Treasury owns the Central Bank. It therefore doesn’t have to pay interest on any loans from the Central Bank If it did, it would get that money back in dividend payments from the Central Bank anyway.
What happens if the Central Bank buys all the Bonds from the Banks? Then the negative equity of the Treasury consists entirely of its debt to the Central Bank (see Figure 13).
Figure 13: Treasury’s books with Central Bank Open Market Operations purchasing all Treasury Bonds
Since those Bonds have been purchased off the Banking Sector, the Banking Sector has Reserves of 160 (see Figure 14). This is not as desirable a situation for the Banks as when they own the bonds, because with no Treasury Bonds they receive no interest payments from the Government. Far from the finance sector in general having “Bond Vigilantes” ready to deny the government bond sales if they’re worried about the state of government finances, the “Bond Vigilantes” are vigilantly on the lookout for sales of Treasury Bonds so that they can swap out of a non-income-earning asset and into an income-earning one.
Figure 14: Banking Sector’s books with OMOs buying 100% of Bonds
In the next post, I’ll consider what the impact is of different fiscal regimes: the government running a deficit (as the USA has for most of the last 120 years—roughly of 2.5% of GDP); the government running a surplus; the government running a surplus and the private sector borrowing from the Banking Sector; the government running a surplus and the private sector reducing its debt to the Banking Sector; and the government running a deficit while the private sector reduces its debt to the Banking Sector.
12 thoughts on “The Mathematical Model of Modern Monetary Theory 2”
Comments are closed.