This is the third in a series of posts documenting the development of a single commodity model of production with energy and matter. In the first I published what appeared to work as a model, but which had obvious scaling issues. In the second, I explained that this first model had errors that I spotted when working with Matheus and Tim: there was no formal link between the output of the energy sector and the energy consumption of all three sectors (energy mining, iron ore mining, factory turning iron ore into iron plus slag).
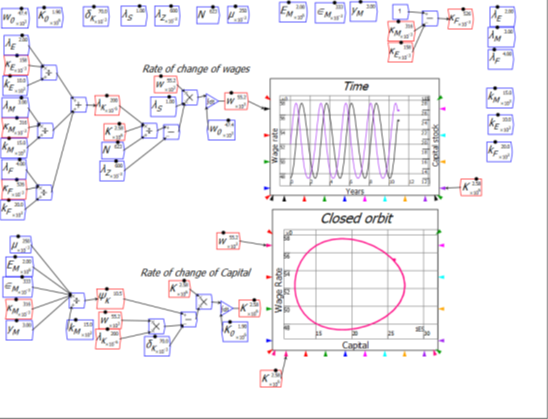
In this post, I can report on an error-free model. Following Matheus’s suggestion, I modelled the system as effectively vertically integrated: the output of both energy and mining was set to meet the needs of the whole economy. Energy output (E, not shown in the model below) was equal to the needs of energy in all three sectors; mining output (or iron ore) was identical, by the conservation of matter, to the matter output of the factory sector (which consists of both iron, and slag).
This made it possible to work with a composite of capital, rather than modelling capital and output in three separate sectors. It led to some complicated constants, but it worked. The product was the expected “Goodwin cycle”, but in this first model occurring in the wage rate (in kilograms of iron per year) and aggregate capital (measured in kilograms of iron).
Now that we’ve completed it, one of the research outputs of our group will be a paper linking the original Goodwin model to these two extensions. They were done both for their own sake—to replace the “ad hoc” productivity in the Goodwin model with something derived from the reality that all production is based on energy—and as a foundation for integrated modelling of economics and ecology. Waste output is easily added to this model, and related to the output of iron; CO2 is easily added and linked to the consumption of energy. Feedbacks can be added from waste generation (both slag and CO2) to the productivity of the economy—the sort of realism that is notably absent from the “Integrated Assessment Models” produced by Neoclassical eCONomists like William Nordhaus and Richard Tol.
I’ll close this Patron-only post with the observation that this project showed up a weakness of Minsky as it stands. Though I’m showing the simulation in Minsky, it was actually easier to do the logical work in Mathcad (see the two files attached to this post; the image below is an excerpt from one of those Mathcad files).
The flowchart paradigm is very useful when you are modelling a causal sequence, but there was a lot of algebraic logic needed to get this model right, and there the direct equation entry capabilities of Mathcad were far easier to use than Minsky’s flowchart.
This is one of the reasons that we plan to add the capability to enter parameter and variable definitions on new tabs within Minsky (currently labelled “parameters” and “variables”). It will take some time and programming nous (supplied by Russell Standish and Wynand Dednam rather than me), but I want to have the same capability to write equations just as you would on paper in Minsky—and then simulate them there.
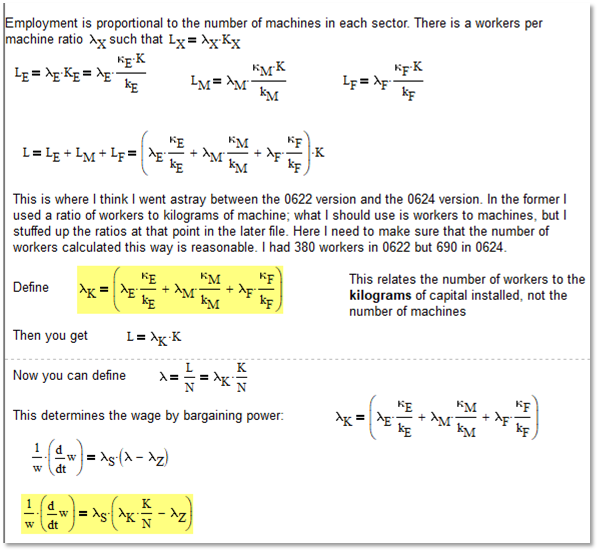
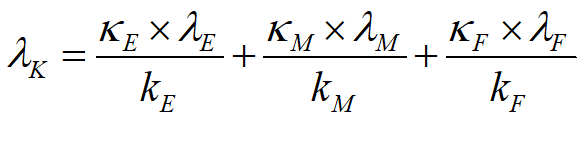
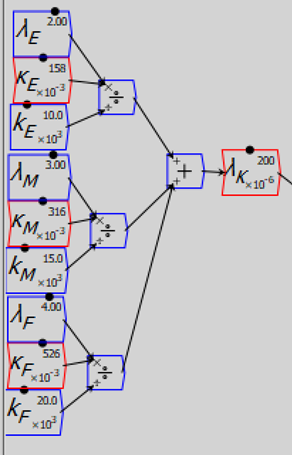
It’s also much easier to read equations—sometimes—than it is to read a flowchart. The first yellow highlighted equation in the figure above is:
If you’re into reading math, then that’s pretty easy to get your head around. Not so the flowchart version of the same, which also takes up much more space:
Anyway, I’m posting these files for the interest of those of you who are into mathematical modelling, and as a courtesy to young students, who will often think, when they see a completed work by an academic, that they couldn’t do the same thing. In fact, a lot of research involves making mistakes which are gradually corrected over time. What you see in a journal paper is often the product of a lot of mistakes that get corrected over time. So don’t ever be discouraged by reading a refereed paper.