I am working with 5 co-authors from climate science, mathematics and non-equilibrium economic modelling on an explanation for scientists of how badly economists have underestimated the possible economic damages from global warming. We’re in the final stages now of writing up the analysis, which of course is slowed down by having to coordinate and edit the inputs of six people into one document; I hope we’ll submit the paper to the journal that invited me to write it by the end of July.
We repeat parts of my paper for Globalizations on the idiotic empirical estimates that Nordhaus, Tol, Mendelsohn and friends have made up (this is a similar open access paper for those who don’t have access to University library databases), but since we’re writing for scientists we’re also delving into the technical details of Nordhaus’s DICE model (“Dynamic Integrated Climate and Economy”) as well.
You need a proprietary economics/optimization program called GAMS to run DICE. We’re using GAMS in the paper itself, but to make it easier for others to play with the core economic equations in DICE, I produced a cut-down version that could be coded into any mathematics program (I use Mathcad, but this could be implemented easily in Mathematica, R, Python, etc.). Figure 1 shows a stylized version of the production components of DICE.
Figure 1: A flowchart explanation of DICE’s economic forecasts
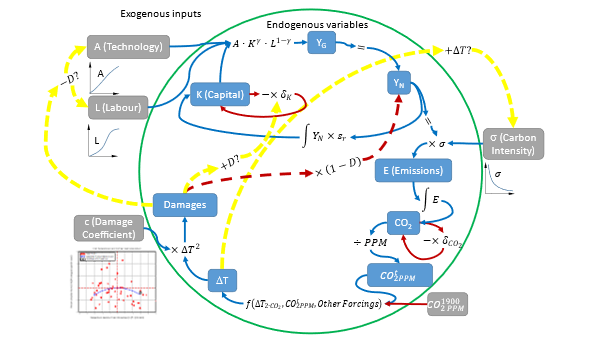
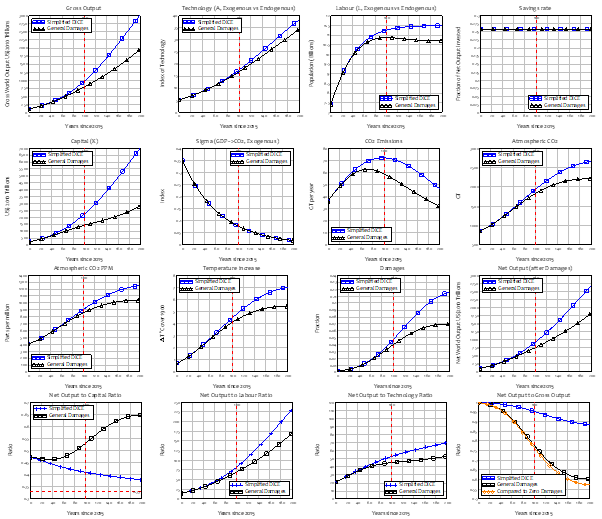
Figure 2 shows the fit of my simplified version to the original in GAMS. I tried to match the model to the outputs of Nordhaus’s DICE for the first 200 years (DICE runs for 500 years), while using much simpler equations. The fit is pretty good for the first 200 years. The only component of my version that differs substantially from Nordhaus’s is the level of CO2 emissions, and even there the fit is pretty spot on for the first 75 years—which takes us to 2090 in real time.
Figure 2: Comparison of non-optimised DICE in GAMS to my simplified model
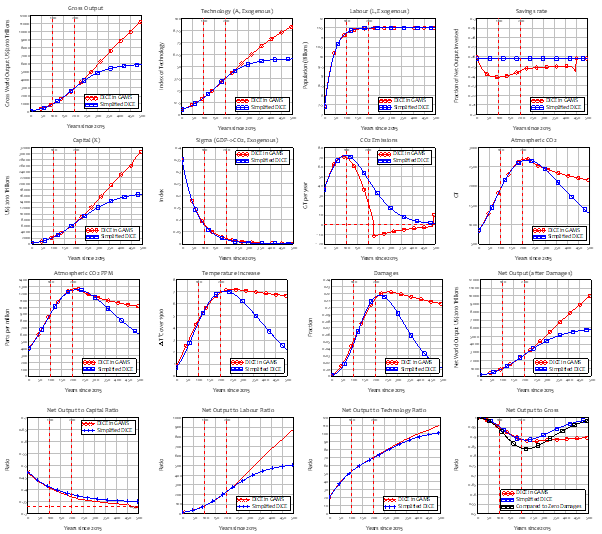
Equation is my simplified version of DICE (with the most significant deviations in model structure and parameter values highlighted in blue). DICE has several very messy iterative equations to generate changing growth rates in technology and population, and about a dozen equations describing the carbon cycle (with the atmosphere divided into 2 bands and the oceans into 3). I worked in continuous time rather than DICE’s klunky 5 year discrete time steps; used a sigmoidal function to replace the iterative loops for A and L, and a simple exponential for ; a constant savings rate rather than a variable; and some constants and a linear equation for temperature change, and adjusted my parameters so that the results conformed, as closely as possible, to the results of a non-optimised run of DICE.
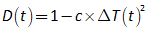
One thing that I’ve noted about Nordhaus’s empirical work applies to his modelling work as well: every choice he makes results in a lower estimate for damages from climate change, rather than a higher one. That is obvious in the design of DICE: the sole impact of global warming on the model economy in DICE is that it reduces output by the factor . Figure 1 makes the obvious point that damages from global warming should affect the inputs to production—technology (A), labour (L) and capital (K) —as well as the output from production. With my simplified version of DICE, it was easy to amend the model to include damages affecting technology and labour (by reducing the growth rates and the long run maxima for both functions) and capital (by adding to the depreciation rate):
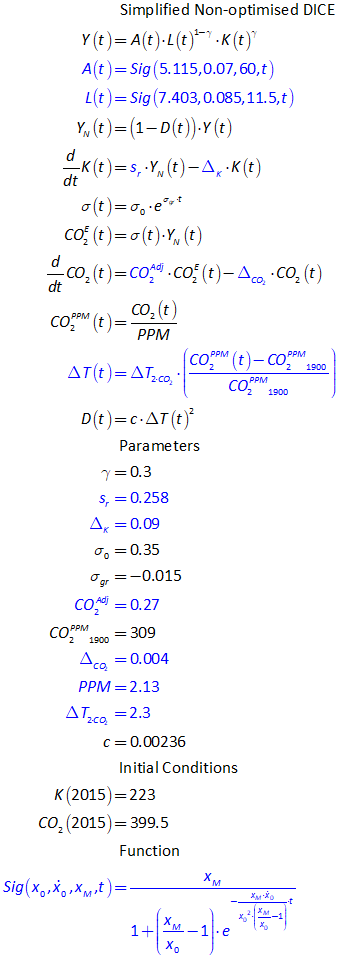
Figure 3 shows the results, and they are—as much as this is possible with DICE—dramatic. Gross output falls substantially (I’ll explain this shortly), capital plunges, emissions and temperatures are lower and, most importantly for this economics-oriented model, rather than output being a mere 12% less in 2215 (200 years from the start of the model) as in DICE, it’s 40% lower.
Figure 3: DICE with damages to the inputs to production as well as the outputs
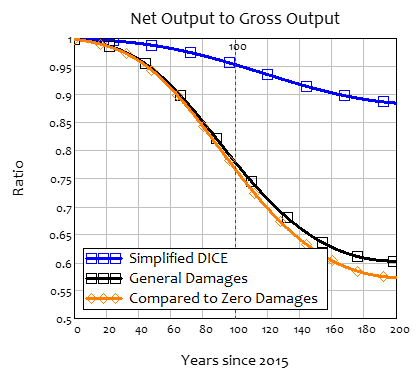
This point is more obvious in Figure 4, which reproduces the bottom right plot in Figure 3. The blue line shows what my simplified model shows as the damages from climate change—and this is virtually identical to the predictions from DICE itself: a 5% fall in GDP after 100 years of unabated climate change, and a 12% fall after 200 years. The black line shows the prediction if damages are applied to the inputs to production as well as the outputs: 22% fall in output after 100 years and 39% after 200 years (the orange line makes a comparison to a run in which damages are zero, since as DICE is set up, “gross” output is affected by climate change since the reduced level of net output affects the level of investment).
Figure 4
My point here (which we’ll make in the paper using DICE itself in GAMS) is that even with his trivial damages function (highlighted in Equation ; the damage coefficient in the 2016 version on Nordhaus’s website; in 2018 he reduced this to 0.00227), had Nordhaus made damages affect the inputs to production as well as the outputs, he would have generated predictions for the economic impact of global warming which would have been troubling. Instead, he trivialized the dangers and let us sleepwalk into the horror story that, it seems, is starting to unfold this decade.
His claim that “carefully controlled environments” would mean that factories, wholesale and retail trade and government would be “negligibly affected by climate change” is looking rather lame this week, with nature giving us some pretty interesting examples of how those “carefully controlled environments” cope with climate change. These “carefully controlled environments” are carefully controlled for the existing climate—not one turbocharged by global warming and everything else we are doing to damage the biosphere.
Figure 5: A German factory during this week’s floods

“Carefully controlled environments”?:
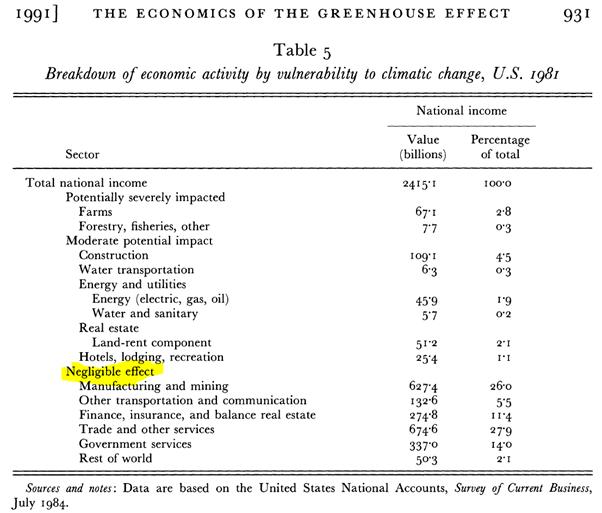
Table 5 shows a sectoral breakdown of United States national income, where the economy is subdivided by the sectoral sensitivity to greenhouse warming. The most sensitive sectors are likely to be those, such as agriculture and forestry, in which output depends in a significant way upon climatic variables. At the other extreme are activities, such as cardiovascular surgery or microprocessor fabrication in ‘clean rooms’, which are undertaken in carefully controlled environments that will not be directly affected by climate change. Our estimate is that approximately 3 0 of United States national output is produced in highly sensitive sectors, another I 00% in moderately sensitive sectors, and about 87 % in sectors that are negligibly affected by climate change. (Nordhaus 1991, p. 930. Emphasis added)
Figure 6: Nordhaus’s classification of US Industry by exposure to climate change
Nordhaus WD (1991) To Slow or Not to Slow: The Economics of The Greenhouse Effect. The Economic Journal 101 (407):920-937. doi:10.2307/2233864