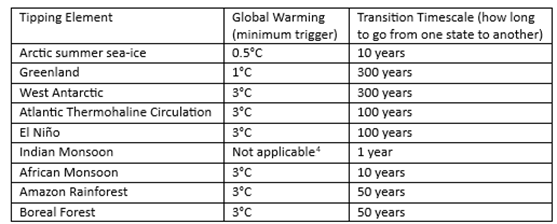
Tipping points—elements of the Earth’s climatic system that can be flipped from one state to another with a relatively minor change in temperature, and which could then cause major and abrupt changes in the climatic system itself—are a key concern for climate scientists (Lenton et al. 2023, p. 36). One of leading scientists in this field is Tim Lenton from Exeter University in the UK, and in 2008 he conducted a survey of experts on what were then regarded as the nine major and most vulnerable such tipping points—see Table 15.105F
The paper “Tipping elements in the Earth’s climate system” concluded that:
Society may be lulled into a false sense of security by smooth projections of global change. Our synthesis of present knowledge suggests that a variety of tipping elements could reach their critical point within this century under anthropogenic climate change. The greatest threats are tipping the Arctic sea-ice and the Greenland ice sheet, and at least five other elements could surprise us by exhibiting a nearby tipping point. (Lenton et al. 2008b, p. 1792. Emphasis added)
I was first alerted to the existence of this paper by a comment in Nordhaus’s manual for DICE—”Dynamic Integrated Climate and Economy”, the mathematical model he constructed by which he converts expected temperature increases into expected economic damages—in which he stated that:
The current version assumes that damages are a quadratic function of temperature change and does not include sharp thresholds or tipping points, but this is consistent with the survey by Lenton et al. (2008) (Nordhaus and Sztorc 2013, p. 11. Emphasis added)
He then elaborated in his book The Climate Casino (Nordhaus 2013) that:
There have been a few systematic surveys of tipping points in earth systems. A particularly interesting one by Lenton and colleagues examined the important tipping elements and assessed their timing… The most important tipping points, in their view, have a threshold temperature tipping value of 3°C or higher … or have a time scale of at least 300 years … Their review finds no critical tipping elements with a time horizon less than 300 years until global temperatures have increased by at least 3°C. (Nordhaus 2013, p. 60. Emphasis added)
Pardon me for stating the obvious, but Nordhaus’s reading of this paper is almost the exact opposite of what the paper actually said.
Far from the triggering of tipping points lying 300 years in the future, Lenton et al. warned that they were likely this century;106F far from a function like a quadratic, with its gradual increase in steepness as temperatures rise, being appropriate for estimating damages, they warned that such a function could lull us into “a false sense of security”; and far from 3°C of warming being required to flip tipping elements from one state to another, they asserted that much lower levels of warming would be sufficient to tip what were then seen as the two most vulnerable, Arctic summer sea-ice107F and Greenland—see Table 15—while five of the remaining seven could “surprise us by exhibiting a nearby tipping point”.
Table 15: Key Features of Tipping elements in Table 1 of (Lenton et al. 2008b, p. 1788)
I would fail any student who submitted what Nordhaus wrote as a summary of Lenton’s paper. But instead, Nordhaus was awarded the “Nobel” Prize in Economics in 2018 for his work on climate change.
If any recipient exposed the real role of this Prize, it is Nordhaus. The Economics “Nobel” Prize was not established by Alfred Nobel, and nor is it funded by the Nobel Foundation.109F It was established by the Swedish Central Bank in 1968, as a means to counter the social-democratic approach to economic policy that was popular in Sweden at the time (Offer and Söderberg 2016). Its formal name is “The Sveriges Riksbank Prize in Economic Sciences in Memory of Alfred Nobel”, and the Nobel family has been campaigning for decades, unsuccessfully, to terminate the Economics award—or to have its name trimmed to “The Sveriges Riksbank Prize”, which doesn’t implicate or piggyback on the Nobel name.110F
Given the fact that the economics departments at top-ranked Universities are dominated by Neoclassical economists, the selection process for this Prize111F means that it is awarded, not for advancing human knowledge as is the case with the real Nobels, but for defending the Neoclassical paradigm from criticism.
Here, Nordhaus did both very well, and very badly.
He did very well, because a core belief of Neoclassical economics is that market solutions are best, except where there is an “externality” in which either the costs or benefits of something are not fully captured in the market price.
Nordhaus treated climate change as an externality, and devised a market-based solution by involving a carbon price derived from what he called the “Social Cost of Carbon” (Nordhaus and Barrage 2023, p. 25). The empirical estimates he and other Neoclassical economists have made of the economic damages from global warming, versus the costs of attenuating those damages, implied that a price of $6 per ton of CO2 in 2022, rising to $90 per ton by 2040,112F would be enough to bring about the optimum balance between damages and the costs of reducing those damages. This, he asserts, would result in a temperature increase by 2100 of 2.7°C above pre-industrial temperatures, with damages to GDP in 2100 of 2.6%, compared to what GDP in 2100 would have been in the absence of global warming (Nordhaus and Barrage 2023, pp. 22-24).
He also defended Neoclassical methodology against the challenge posed by the system dynamics approach developed by Jay Forrester, and embodied both in The Limits to Growth (Meadows, Randers, and Meadows 1972) and its predecessor World Dynamics (Forrester 1971, 1973). Nordhaus not only denigrated the system dynamics approach (Nordhaus 1973, 1992a), but also developed an alternative based on the Neoclassical Ramsey Growth model (Ramsey 1928), DICE (Nordhaus 1993b). This was the world’s first “Integrated Assessment Model” (IAM), and since then, the economic analysis of climate change has been dominated by Neoclassical models—including Richard Tol’s FUND (Tol 1995) and Chris Hope’s PAGE (Hope, Anderson, and Wenman 1993)—rather than descendants of WORLD3, the system dynamics model behind the Limits to Growth.
However, Nordhaus also did very badly, because methods by which he derived empirical estimates of the economic damages from climate change were so transparently wrong that—despite my low opinion of Neoclassical economics in general—even I was shocked that these methods were accepted by referees. The referees of the “top” economics journals are exclusively Neoclassical economists, who have a similar devotion to the Neoclassical paradigm as Nordhaus, and comparable ignorance about the real world. But I was still stunned that they did not object to the bizarre empirical assumptions that Nordhaus made.
Other disciplines would not have been so forgiving. Any climate scientist would have rejected his first technique—later dubbed the “Enumerative Method” (Tol 2009, pp. 31-32)—when Nordhaus proposed it back in 1991 in “To Slow or Not to Slow: The Economics of The Greenhouse Effect” (Nordhaus 1991, pp. 930-931). Any self-respecting statistician would have rejected the second “Statistical” or “Cross-Sectional” method, which was developed by Nordhaus’s colleague Robert Mendelsohn (Mendelsohn et al. 2000).113F The “expert surveys” Nordhaus conducted (Nordhaus 1994a; Nordhaus and Moffat 2017) would likewise have been torn apart by any experienced market researcher. Subsequent variations on these themes (Burke, Hsiang, and Miguel 2015; Kahn et al. 2021; Dietz et al. 2021a) would have been rejected by any scientist with an understanding of tipping points.
These methods do not, in Solow’s colourful phrase, “pass the smell test: does this really make sense?”. But they survived refereeing because they were evaluated by advocates of Neoclassical economics who “no doubt believe what they say, but they seem to have stopped sniffing or to have lost their sense of smell altogether” (Solow 2010).
Policymakers, media, the finance sector, and much of the general public, who are unaware of what Lenton later described as the “huge gulf” (Lenton and Ciscar 2013, p. 585) between economists and climate scientists, have acted as if the economists’ estimates of damages are based on the work of scientists, and are therefore valid. As a consequence, humanity has taken trivial actions to combat climate change to date. Fossil fuel companies may have waged the war against action on climate change, but economists have been the arms dealers who have made the weapons of mass deception with which they have waged that war.
The great irony of the success of the fossil fuel disinformation campaign against action on global warming is that the weapons crafted for them by economists are so pathetically bad. I remember, before I started reading this literature, expecting to face the difficult task of explaining to a non-mathematical audience why the Ramsey growth model was the wrong foundation for modelling climate change, or why discount rates for damages should be low rather than high, and so on.114F But in fact, there was no need.
The fatal flaws in their analysis are fundamentally due to the ridiculously low estimates they have made, using ridiculously bad methods, of the damages that global warming will do to the economy. Even if the Ramsey growth models at the core of DICE, FUND, PAGE and other IAMs were perfect descriptions of reality—and they are far from that—then feeding in the numbers that economists have made up about global warming into those models would still vastly underestimate the damages that it will do to the economy. It’s all in the numbers, and the methods they’ve used to make up those numbers are statistical nonsense.
-
Confusing the Weather with the Climate
My first exposure to the “enumerative method” was via the bland statement made about it by Tol in “The Economic Effects of Climate Change”:
Fankhauser (1994, 1995), Nordhaus (1994a), and me [sic.] (Tol, 1995, 2002a, b) use the enumerative method. In this approach, estimates of the “physical effects” of climate change are obtained one by one from natural science papers, which in turn may be based on some combination of climate models, and laboratory experiments. The physical impacts must then each be given a price and added up. For agricultural products, an example of a traded good or service, agronomy papers are used to predict the effect of climate on crop yield, and then market prices or economic models are used to value the change in output. (Tol 2009, pp. 31-32)
Superficially, this sounds like an unobjectionable method. But, as I put it in my first paper on this topic, “it’s what you don’t count that counts” (Keen 2020, p. 3). Only when I read Nordhaus’s 1991 paper “To Slow or Not to Slow: The Economics of The Greenhouse Effect” (Nordhaus 1991)—which, for no good reason, Tol did not include in his list of relevant papers115F—did I realise that the foundation of this method is assuming that climate is equivalent to the weather.
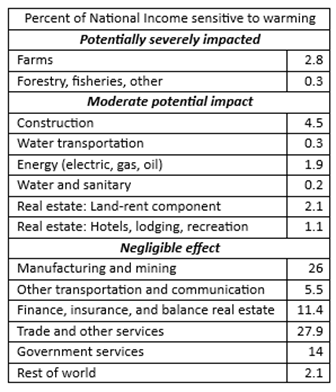
Nordhaus assumed that sectors that were “affected by climate change” would be those whose “output depends in a significant way upon climatic variables“. He then, on that assumption, assumed that fully 87% of America’s GDP would be “negligibly affected by climate change“:
Table 5 shows a sectoral breakdown of United States national income, where the economy is subdivided by the sectoral sensitivity to greenhouse warming. The most sensitive sectors are likely to be those, such as agriculture and forestry, in which output depends in a significant way upon climatic variables. At the other extreme are activities, such as cardiovascular surgery or microprocessor fabrication in ‘clean rooms’, which are undertaken in carefully controlled environments that will not be directly affected by climate change. Our estimate is that approximately 3% of United States national output is produced in highly sensitive sectors, another 10% in moderately sensitive sectors, and about 87% in sectors that are negligibly affected by climate change. (Nordhaus 1991, p. 930. Emphasis added)
The only thing that most of the industries in Nordhaus’s list of those that are “negligibly affected by climate change” have in common is that they are not directly exposed to the weather—see Table 16.
Table 16: Summary of Table 5 in (Nordhaus 1991, p. 931)
I emphasise “most”, because amongst the industries he claims will be negligibly affected is mining—some of which is open-cut, and therefore exposed to the weather.116F He reiterated this in the text of this paper:
for the bulk of the economy—manufacturing, mining, utilities, finance, trade, and most service industries—it is difficult to find major direct impacts of the projected climate changes over the next 50 to 75 years. (Nordhaus 1991, p. 932. Emphasis added)
In a sign that he really was confusing climate with weather, he amended this to underground mining in a subsequent paper—while still making the same claim that “most of the U.S. economy has little direct interaction with climate” and is therefore “unlikely to be directly affected by climate change”:
most of the U.S. economy has little direct interaction with climate… underground mining, most services, communications, and manufacturing are sectors likely to be largely unaffected by climate change—sectors that comprise around 85 percent of GDP. (Nordhaus 1993a, p. 15)
More significant though is his admission that for “the bulk of the economy” he found it “difficult to find major direct impacts of the projected climate changes over the next 50 to 75 years”.
Nordhaus found this difficult only because he is a Neoclassical economist. The obvious direct impact is humanity’s use of fossil fuels as energy sources for all the industries he thought would be “negligibly affected by climate change”. If the impacts of climate change become catastrophic for humanity as global temperatures increase, then it is feasible that energy for these industries will be curtailed, and their output will plummet. The only reason this was not obvious to him is that the Neoclassical model of production omits any role for energy, as I explained in Chapter 13.
The mistake of believing that manufacturing occurs in “carefully controlled environments” is a classic example of confusing the map (the aggregate production function) with the territory (the real world). The use of an aggregate production function  , in which output Y is a function F() of inputs of Labour L and Capital K, has led him to ignore, not only that energy and raw material inputs from the natural world are needed to enable factories (and offices) to function, but also that manufacturing doesn’t occur inside the brackets of a production function, but inside millions of factories, connected by the web of fossil-fuel-driven transportation systems that we have weaved across the surface of the planet. If storms destroy roads—as they did in 2022 in Canada, cutting Vancouver off from the rest of the country117F—then that web of output breaks down. All manufacturing does not occur exclusively in “carefully controlled environments”, and the millions of essential connections between the natural world and factories, and between factories themselves, have very large and direct interactions with climate.
Ignorant of all the above issues, this first use of the “enumerative method” led Nordhaus to conclude that 3°C of global warming would decrease future GDP by a mere one quarter of one percent:
We estimate that the net economic damage from a 3°C warming is likely to be around ¼% of national income for the United States in terms of those variables we have been able to quantify. This figure is clearly incomplete, for it neglects a number of areas that are either inadequately studied or inherently unquantifiable. We might raise the number to around 1% of total global income to allow for these unmeasured and unquantifiable factors, although such an adjustment is purely ad hoc. It is not possible to give precise error bounds around this figure, but my hunch is that the overall impact upon human activity is unlikely to be larger than 2% of total output. (Nordhaus 1991, pp. 932-933. Emphasis added)
“Hunch“? What on earth is the word “hunch” doing in an allegedly scientific paper? And yet, in a sign of the cavalier way in which Neoclassical economists in general treat the topic of global warming, the Editor of the journal which published Nordhaus’s paper—the prestigious Economic Journal—glossed over this and many other flaws in Nordhaus’s paper, to observe that:
On the basis of the standard scientific benchmark, namely a doubling of carbon dioxide equivalent in the atmosphere, Nordhaus reaches the conclusion that climate change is likely to produce a combination of gains and losses. Moreover, he argues that there is no strong presumption of substantial net economic damages. As he points out, this does not necessarily mean that there is a strong case for inaction but rather that the arguments for intervention need to be thought through carefully. The assessment is certainly a sobering antidote to some of the more extravagant claims for the effects of global warming. (Greenaway 1991, p. 902. Boldface emphasis added)
This epitomises the attitude of Neoclassical economists in general. Lacking any understanding of the role of energy in production, mistaking the map (their model of production) for the territory (the actual system of production), and having no formal training in the physical sciences, the majority of Neoclassical economists simply don’t believe that climate change can be a significant problem. Nordhaus supplied the answer that they expected and wanted, and little critical attention was paid as to how he produced that answer.
-
Confusing Space with Time
While it took some detective work to realise that “the enumerative method” was absurd, as I note in the previous chapter, the ludicrous nature of “the statistical approach” (also called “cross-sectional”) was obvious as soon as I saw it:
An alternative approach, exemplified in Mendelsohn’s work, can be called the statistical approach. It is based on direct estimates of the welfare impacts, using observed variations (across space within a single country) in prices and expenditures to discern the effect of climate. Mendelsohn assumes that the observed variation of economic activity with climate over space holds over time as well; and uses climate models to estimate the future effect of climate change. (Tol 2009, p. 32. Emphasis added)
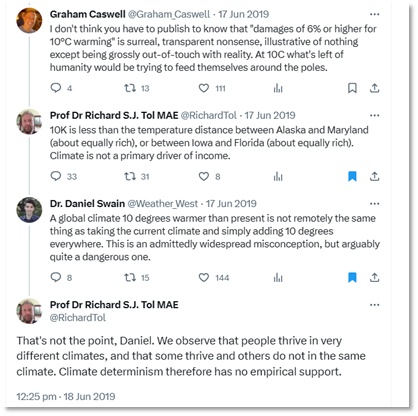
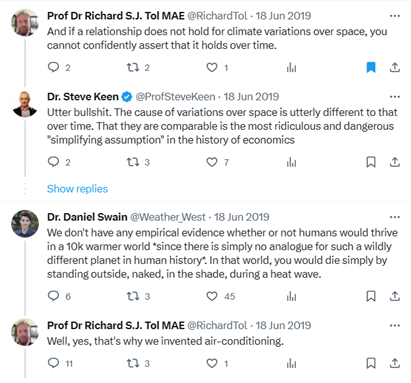
The misconception that global warming over time from rising CO2 levels will have a trivial impact upon the economy, because human societies function across a wide range of climates today, is a common refrain by climate change deniers. But I was stunned to see it repeated by an academic—even if he was a Neoclassical economist. However, not only did Tol report on this approach in his paper, he defended it in numerous tweets in response to criticism by me, and by climate scientists—see Figure 61 and Figure 62.
Figure 61 : Twitter exchanges over “the statistical approach” on June 17-18 2019
Figure 62: Twitter exchanges over “the statistical approach” on June 18 2019
There are so many ways in which this assumption—that today’s data on temperature and GDP can be used to predict the impact of global warming on the economy—that it’s hard to know where to start.
The most obvious fallacy is that space is not interchangeable with time! Despite Tol’s blasé statement that “if a relationship does not hold for climate variations over space, you cannot confidently assert that it holds over time”,118F the former cannot be used as a proxy for the latter.
If that isn’t immediately obvious to you, there are two more technical points that show this method is absurd.
The first is that the incomes of hot, temperate, and cold regions today are not independent. Hot locations, such as Florida, gain part of their income today by selling across space today to temperate places like Maryland and cold places like Alaska, and vice versa. But a future hotter Earth can’t trade across time with the colder Earth today.
To use comparisons of income variations today due to temperature differences today as a proxy for the effect of rising global temperatures on future Gross World Product, then at the very least you would need to correct for this income dependence across space, by excluding income that a hot region gains from trading with a cold region, and vice versa. Only products that are produced and consumed in cold, temperate and hot regions respectively should be used in the comparison. This would result in a much steeper relationship between temperature and income, but this was not even contemplated by the economists who used this method, let alone done.
Secondly, the mathematical term for a system which obeys Tol’s assumption—that a relationship that holds over space also holds over time—is that it is “ergodic” (Peters 2019; Drótos, Bódai, and Tél 2016). If this assumption holds, then, as the mathematician Ole Peters put it:
dynamical descriptions can often be replaced with much simpler probabilistic ones — time is essentially eliminated from the models. (Peters 2019, p. 1216)
However, ergodicity is a valid assumption only under a very restrictive set of conditions, and economists in general are unaware of this:
The conditions for validity are restrictive, even more so for non-equilibrium systems. Economics typically deals with systems far from equilibrium — specifically with models of growth… the prevailing formulations of economic theory … make an indiscriminate assumption of ergodicity. (Peters 2019, p. 1216. Emphasis added)
Using necessarily technical language, the physicists Drótos and Tél and the meteorologist Bódai are emphatic that “ergodicity does not hold” for the climate:
In nonautonomous dynamical systems, like in climate dynamics, an ensemble of trajectories initiated in the remote past defines a unique probability distribution, the natural measure of a snapshot attractor, for any instant of time, but this distribution typically changes in time. In cases with an aperiodic driving, temporal averages taken along a single trajectory would differ from the corresponding ensemble averages even in the infinite-time limit: ergodicity does not hold. (Drótos, Bódai, and Tél 2016, p. 022214-1. Emphasis added)
Therefore, you cannot, in principle, use climate across space as a proxy for climate across time. But this is what these economists did.
They also assumed, like Nordhaus before them (Nordhaus 1991), that only industries exposed to the weather would be affected by climate change: to quote Mendelsohn et al., “A separate model is designed for each sensitive market sector: agriculture, forestry, energy, water, and coastal structures” (Mendelsohn, Schlesinger, and Williams 2000, p. 39)
Finally, like Nordhaus, they simply assumed that population and economic growth in the aggregate would continue, despite a more than doubling of CO2 over pre-industrial levels (their final numerical estimates were of damages to this assumed future GDP in the absence of global warming):
We assume that humankind commits itself to a maximum equivalent CO2 concentration of 750 ppmv, which implies a carbon dioxide concentration of 612 ppmv in 2100. We assume that global population has doubled to 10 billion and that the global gross domestic product (GDP) is 217 trillion, a ten-fold increase. (Mendelsohn, Schlesinger, and Williams 2000, p. 38. Emphasis added)
With methods like these, it’s little wonder that Mendelsohn et at. predicted an even lower level of economic damages from global warming than Nordhaus generated from his “enumerative” method. They claimed that the relationship between global warming and GDP was parabolic (which Nordhaus also assumed), they described a 2.5C increase in global temperatures by 2100 as “modest”, and they predicted effectively no impact of that warming on GDP:
The climate-response functions in these studies were quadratic in temperature… Countries that are currently cooler than optimal are predicted to benefit from warming. Countries that happen to be warmer than optimal are predicted to be harmed by warming … the modest climate-change scenarios expected by 2100 are likely to have only a small effect on the world economy. The market impacts predicted in this analysis do not exceed 0.1% of global GDP and are likely to be smaller.(Mendelsohn, Schlesinger, and Williams 2000, pp. 41, 46. Emphasis added)
Surveying mainly economists about Global Warming
As I noted earlier, I was alerted to existence of an expert survey of climate scientists about global warming and tipping points (Lenton et al. 2008b) by Nordhaus’s utterly false interpretations of its results (Nordhaus and Sztorc 2013, p. 11.; Nordhaus 2013, p. 60 ). This study is an exemplar of how expert surveys should be conducted.
The survey was preceded by a workshop at which the survey was trialled, after which 193 experts were identified from the literature, 52 of whom responded. Each respondent had expertise on a specific tipping point, and they were “encouraged to remain in their area of expertise” (Lenton et al. 2008a, p. 10). The key concept of “tipping elements” was carefully defined as “large elements of the planet’s climatic system (>1,000km in extent) which could be triggered into a qualitative change of state by increases in global temperature that could occur this century” (Lenton et al. 2008b, p. 1788).
Nordhaus’s paper “Expert Opinion on Climatic Change” (Nordhaus 1994b) was a caricature of this careful process. It began with a letter to three people “two experts in climatic change and one economist who had extensive experience in surveys)” (Nordhaus 1994b, p. 45), but from that point on it was biased to select economists rather than a broad range of disciplines. It ended with 19 respondents—”10 economists, four other social scientists and five natural scientists and engineers” (Nordhaus 1994b, p. 46)—but only 3 of the scientists had expertise in climate, while Nordhaus described 8 of the 10 economists as people “whose principal concerns lie outside environmental economics” (Nordhaus 1994b, p. 48)—meaning, of course, that they were not experts.119F
Furthermore, one of the scientists refused to answer Nordhaus’s key questions about the economic impact of global warming, stating that:
I must tell you that I marvel that economists are willing to make quantitative estimates of economic consequences of climate change where the only measures available are estimates of global surface average increases in temperature. As [one] who has spent his career worrying about the vagaries of the dynamics of the atmosphere, I marvel that they can translate a single global number, an extremely poor surrogate for a description of the climatic conditions, into quantitative estimates of impacts of global economic conditions. (Nordhaus 1994b, p. 51)
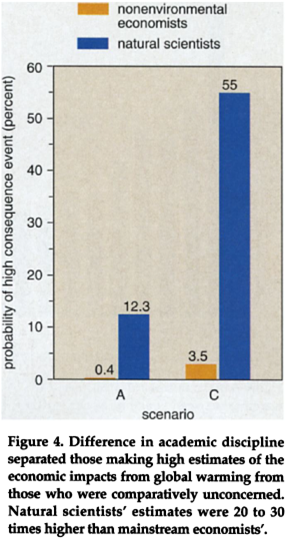
The most notable aspect of the survey was the huge gulf between the 8 non-expert economists and the two climate scientists who answered Nordhaus’s key questions. This asked for a prediction of damage to GDP in 2090 from 3°C (scenario A) and 6°C of warming (scenario C) respectively. Nordhaus noted that “Natural scientists’ estimates were 20 to 30 times higher than mainstream economists”—see Figure 63—and commented that “This difference of opinion is on the list of interesting research topics” (Nordhaus 1994b, pp. 49- 50), but this research was never done.
Figure 63: (Nordhaus 1994b, p. 49) noting the difference of opinion between climate scientists and economists
Nordhaus then used the average of the predictions from his 18 respondents as the damage prediction from this paper, thus diluting the extreme concern of 2 climate scientists in the blasé confidence of 8 non-expert economists, who were generally of the mind, as one of them put it, that:
the degree of adaptability of human economies is so high that for most of the scenarios the impact of global wanning would be “essentially zero.” (Nordhaus 1994b, p. 49)
A Summing Up in 2009
Tol summarised these results in his Table 1 (see Figure 64), and commented that “Given that the studies in Table 1 use different methods, it is striking that the estimates are in broad agreement on a number of points” (Tol 2009, p. 33). But this is spurious: the methods were all worse that suspect, all dramatically minimised the dangers, and the economists involved all shared the assumption that “exposed to climate change” meant “exposed to the weather”.
Figure 64: Table 1 from(Tol 2009, p. 31)

The real conclusion, which Tol also noted, is that these comparable predictions are a product of groupthink:
it is quite possible that the estimates are not independent, as there are only a relatively small number of studies, based on similar data, by authors who know each other well… although the number of researchers who published marginal damage cost estimates is larger than the number of researchers who published total impact estimates, it is still a reasonably small and close-knit community who may be subject to group-think, peer pressure, and self-censoring. (Tol 2009, pp. 37, 43. Emphasis added)
The groupthink continued with new methods developed by the small but growing army of economists making an academic career out of publishing estimates of economic damages from global warming. Though some of these subsequent estimates are much larger than the norm reported by Tol for studies between 1994 and 2006—of damages to future GDP of about 1-2% from 2.5°C of warming—they are still based on spurious assumptions, and estimate damages that far lower than we are likely to experience.
-
Assuming No Change to the Climate from Global Warming
The economic study that predicts the highest damages from global warming is Burke, Hsiang, and Miguel’s 2015 paper “Global non-linear effect of temperature on economic production”: it predicts a 23% fall in global income in 2100 from a 4°C increase in global average temperature over pre-industrial levels:
If future adaptation mimics past adaptation, unmitigated warming is expected to reshape the global economy by reducing average global incomes roughly 23% by 2100. (Burke, Hsiang, and Miguel 2015. Emphasis added)
But what do they mean by the text I’ve highlighted—”If future adaptation mimics past adaptation“?
They mean, in effect, that they are assuming no change to the climate from global warming. That might sound bizarre—it is bizarre—but it is a product of their method, which was to use a database of temperatures and GDP over the period from 1960-2010, and then to derive a quadratic relationship between change in temperature and GDP for the period 1960-2010. They then extrapolated this relationship forward to 2100—implicitly assuming that the increase in global temperatures from 2015 till 2100 would not make the relationship they derived from 1960-2010 data invalid.
This method was subsequently mimicked by (Kahn et al. 2021), using a later version of this database with data to 2014, to assert that “if temperature rises (falls) above (below) its historical norm by 0.01°C annually for a long period of time, income growth will be lower by 0.0543 percentage points per year” (Kahn et al. 2021). Using this relationship for data from 1960 till 2014, then then predicted that:
an increase in average global temperature of 0.04°C per year [from 2020] … reduces world’s real GDP per capita by 7.22 percent by 2100. (Kahn et al. 2021, p. 3)
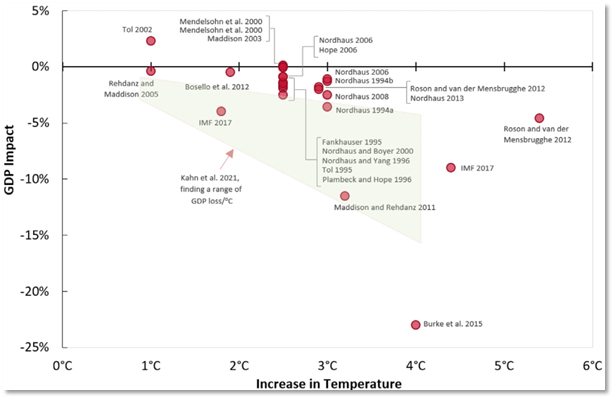
The fact that this prediction was based on a linear extrapolation of the result they derived for 1960-2014 is obvious in their Figure 2—reproduced here as Figure 65.
Figure 65: Figure 2 from (Kahn et al. 2021, p. 4) showing point estimates by other economists and their range estimate
This approach, of course, ignores the impact of tipping points, which could change the structure of the planet’s atmospheric and water circulation systems completely, and make any knowledge garnered from the pre-tipping points climate irrelevant.
Fortunately for these economists, if not for human civilisation, another group of economists predicted that tipping 8 major components of the Earth’s climate—Arctic summer sea-ice, the Greenland and West Antarctic ice sheets, the Amazon rainforest, the Atlantic Meridional Overturning Circulation, permafrost, ocean methane hydrates, and the Indian monsoon—would reduce global income by a mere 1% at 3°C of warming, and 1.4% at 6°C.
-
Reducing Tipping Points to Degrees
The paper that made this claim reached the apogee of economic delusion over climate change—though there may yet be even more absurd extensions to this literature.
The first four tipping points they consider would make Earth visibly different from space: the Arctic would be deep blue, and Greenland and the West Antarctic would be brown, rather than white; the Amazon would be brown rather than green. If the AMOC stops, the distribution of heat around the planet would be drastically altered: Western Europe and Scandinavia would be 2-5°C colder (Vellinga and Wood 2008, p. 59), while other regions would be commensurately warmer, with temperatures in South Asia rising by 2-3°C (Vellinga and Wood 2008, Figure 2, p. 50). The Permafrost and Ocean Methane Hydrates contain several times as much carbon as is currently in the atmosphere. And the lives of well over a billion people are structured around the current behaviour of the Indian monsoon.
The claim that these drastic changes to the Earth’s climatic system would cause a mere 1.4% fall in future GDP is absurd, and I and several colleagues, including the climate scientist Tim Lenton, said so in a letter to Proceedings of the National Academy of Sciences, the journal that published this paper (Keen et al. 2022). In a sign of just how disconnected from reality climate economists are, the authors of this study were surprised that we thought that impacts would be larger:
Keen et al. argue the conclusions and procedures in ref. 2 do not make sense, seemingly taking it as given that the economic impacts of climate tipping points will be larger than our estimates. (Dietz et al. 2022. Emphasis added)
They also defended themselves with the claim that “Dietz et al. modeling of climate tipping points is informative even if estimates are a probable lower bound” (Dietz et al. 2022).
These comments show how apt Robert Solow’s comment was, after the “Global Financial Crisis”, that many economists seem have lost their sense of smell (Solow 2010), and can make statements that are obviously nonsense, but not see that themselves.
A 1.4% fall of future GDP is only marginally greater than no fall at all. Normal people—that is, anyone who is neither a Neoclassical economist nor a climate change denier—would guess that climatic effects as severe as this paper contemplated would mean 100% destruction of the economy, not zero. It is in no way useful today to say that the fall in GDP will be 1.4%, rather than zero—there’s virtually no difference between them. Instead, this feeds into the delusions already built into this literature, that climate change is a minor issue, by portraying the most dangerous aspect of climate change—tipping points—as an equally trivial problem.
Dietz et al. also asserted that the impact of tipping points can be modelled using a “second-order polynomial”:
Tipping points increase the temperature response to GHG emissions over most of the range of temperatures attained … Using a second-order polynomial to fit the data, 2℃ warming in the absence of tipping points corresponds to 2.3℃ warming in the presence of tipping points, for instance. … Tipping points reduce global consumption per capita by around 1% upon 3℃ warming and by around 1.4% upon 6℃ warming, based on a second-order polynomial fit of the data. (Dietz et al. 2021a, p. 5. Emphasis added)
For non-mathematical readers, a second order polynomial (AKA a “quadratic”) asserts that the value of one variable is equal to a constant, multiplied by the value of another variable squared. In this case, economic damages are alleged to be equal to a constant multiplied by the increase in global average temperature squared.
As I discuss in the next section, this is an inappropriate function to use for modelling global warming in general. But it is particularly inappropriate here, since it contradicts the formal definition of a tipping point given by scientists in “Tipping elements in the Earth’s climate system” (Lenton et al. 2008b):
a system is a tipping element if the following condition is met: 1. The parameters controlling the system can be transparently combined into a single control … , and there exists a critical control value … from which any significant variation … leads to a qualitative change … in a crucial system feature … (Lenton et al. 2008b, p. 1786)120F
In the case of tipping points triggered by global warming, the control is the global average temperature, and the critical control value is the temperature at which the state of the tipping point, say the Arctic Ocean,121F is altered from one state to another—in this example, from ice-covered during summer to ice-free. The qualitative change is that a surface which used to reflect 90% of sunlight now absorbs 90%, and hence changes from cooling the planet to warming it.
To emulate this with a smooth mathematical function, at the very least you need a function whose rate of acceleration increases as global temperatures increase past the critical level. A quadratic cannot do this, since the rate of acceleration of a quadratic never changes.
Regardless, using this paper, Nordhaus is now claiming that he has incorporated the impact of tipping points in DICE:
Second, we have added the results of a comprehensive study of tipping points (Dietz et al. 2021), which estimates an additional 1% loss of global output due to 3 °C warming. (Nordhaus and Barrage 2023, pp. 8-9).
He has done this mainly by increasing the single parameter in his quadratic damage function from 0.00227 to 0.003467, thus resulting in a small increase in expected damages—rather than the catastrophic impacts rightly anticipated by climate scientists. This is the first time since 1992 that he has increased the value of his damage parameter—see Table 17—but this in no way accounts for tipping points.
-
Assuming Constant Acceleration in Economic Damages
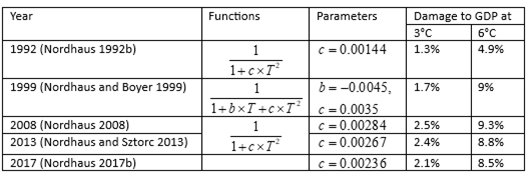
Nordhaus’s damage function has taken different forms over the life of DICE from 1992 till 2023—see Table 17 for its various incarnations—but the fundamental assumption has remained that economic damages from global warming will be proportional to the temperature change squared. Table 17 shows the form this function has taken, the parameters, and the predicted damages these functions return at 3°C and 6°C increases over pre-industrial levels.
Table 17: The damage function in Nordhaus’s DICE over time
This practice is rife amongst Neoclassical climate change economists, and it has absolutely no empirical or theoretical justification. In fact, this is one aspect of their modelling which has been consistently criticized by other economists—and in language similar to mine, rather than the anodyne norms of academic discourse:
Numerous subjective judgements, based on fragmentary evidence at best, are incorporated in the point estimate of 1.8% damages at 2.5°C … The assumption of a quadratic dependence of damage on temperature rise is even less grounded in any empirical evidence. Our review of the literature uncovered no rationale, whether empirical or theoretical, for adopting a quadratic form for the damage function—although the practice is endemic in IAMs. (Stanton, Ackerman, and Kartha 2009, p.172. Emphasis added)
Modelling climate economics requires forecasts of damages at temperatures outside historical experience; there is no reason to assume a simple quadratic (or other low-order polynomial) damage function. (Stanton, Ackerman, and Kartha 2009, p.179. Emphasis added)
this damage function is made up out of thin air. It isn’t based on any economic (or other) theory or any data. Furthermore, even if this inverse quadratic function were somehow the true damage function, there is no theory or data that can tell us the values for the parameters. (Pindyck 2017, p. 104. Emphasis added)
This paper asks how much we might be misled by our economic assessment of climate change when we employ a conventional quadratic damages function and/or a thin-tailed probability distribution for extreme temperatures… These numerical exercises suggest that |we might be underestimating considerably the welfare losses from uncertainty by using a quadratic damages function. (Weitzman 2012, p. 221)
Despite this criticism, Neoclassical climate change economists persist in using such a simple and misleading function: they acknowledge, and then ignore, their critics. In manual for the latest version of DICE, Nordhaus blandly states that:
Based on recent reviews, we further assume that a quadratic damage function best captures the impact of climate change on output (Nordhaus and Moffat, 2017; Hsiang et al., 2017). (Nordhaus and Barrage 2023, p. 8. Emphasis added)
But these “reviews” were by other economists who are just as deluded as Nordhaus, and considered statistical regressions of change in temperature data today against GDP today—in other words, they were based on the fallacy that today’s variations in climate and income across space can be used to predict the consequences climate change over time on the global economy.
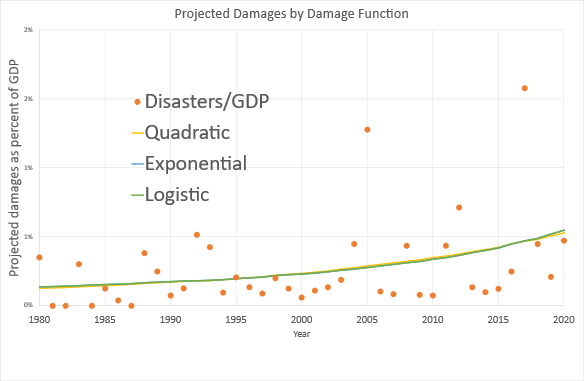
To illustrate just how misleading this assumption is, Brian Hanley and I decided to compare a quadratic damage function to an exponential and a logistic function in (Keen and Hanley 2023).123F The data to which we fitted these functions was the USA’s National Oceanic and Atmospheric Administration (NOAA) Billion Dollar Damages Database.124F Across the actual range of recorded data, the functions are indistinguishable: despite appearances, there are 3 lines in Figure 66, not just one.
Figure 66: The fit of quadratic, exponential and logistic functions to the NOAA Billion Dollar Damages database
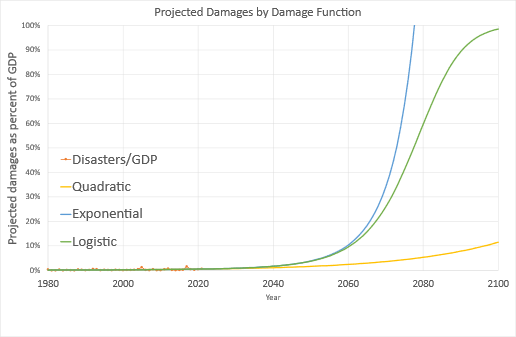
However, when you extrapolate those functions forward, the outcome is dramatically different. The quadratic extrapolation predicts damages within the ballpark set by Nordhaus and his acolytes, of a roughly 10% fall in future GDP by 2100. But the logistic suggests complete destruction of GDP in 2100, while the exponential implies that human civilisation will end by 2080—see Figure 67.
Figure 67: The extrapolation of quadratic, exponential and logistic functions from the NOAA Billion Dollar Damages database
Neither of our “predictions” are meant as such: we dispute the very concept of finding the fingerprint of global warming in current data. But if you are going to undertake that experiment, then at least do it with reliable 3rd party data like NOAA’s database, rather than numbers you’ve made up yourselves—as economists have done. And don’t only fit functions to your “data” which by assumption assert that global warming can’t be a problem—as economists have done by persisting with quadratic damage functions.
Of course, the longer you wait, the more likely you are to find evidence of global warming in current economic damages. The whole point of climate change research—before it was hijacked by economists—was to avoid this experience in the first place, by giving humanity sufficient warning to change its ways and avoid catastrophe. Now, thanks to the appallingly bad work by economists, and its success in persuading politicians that global warming is a problem of the 22nd century rather than the 21st, we are highly likely to experience that catastrophe—and in the immediate rather than the far distant future.
-
Modelling Weather without Precipitation
Another sign of the cavalier way economists have treated climate change is that their “Integrated Assessment Models” (IAMs) include the impact of temperature on the economy, but not precipitation. Dietz et al. note, when explaining the results of the study they used to assess the impact of losing the AMOC on the economy, that:
AMOC slowdown is expected to have physical effects other than temperature change, for instance effects on precipitation and regional sea levels, but these have yet to be incorporated in economic studies. (Dietz et al. 2021b, p. 25. Emphasis added)
This is an outrageous failing: it has been more than 30 years since the first IAM, Nordhaus’s DICE, was published in 1992 (Nordhaus 1992b). And yet no economist has yet tried to include rainfall in addition to temperature in his—they are exclusively men—model of global warming!125F
This failing lies behind possibly the most ridiculous claim in this literature, that losing the Atlantic Meridional Overturning Circulation—which is part of the planet-spanning “Thermohaline Circulation” (THC)—will actually boost the economy. This came from a study using Tol’s IAM “FUND”, in which the authors claimed that:
If the THC slows down a little, the global impact is a positive 0.2-0.3 percent of income. This goes up to 1.3 percent for a more pronounced slowdown. (Anthoff, Estrada, and Tol 2016, p. 604. Emphasis added)
This is nonsense, as was pointed out when actual climate scientists tackled the same issue using their far more sophisticated GCMs. In a study for the OECD, which considered the impact of the collapse of the AMOC in conjunction with a 2.5°C rise in temperature, Lenton concluded that this would cause a 70% fall in the proportion of the planet’s land surface that is suitable for growing corn and wheat. Far from having a positive impact on income, he stated that:
an AMOC collapse would clearly pose a critical challenge to food security. Such a collapse combined with climate change would have a catastrophic impact. (OECD 2021, p. 151. Emphasis added)
Tol and his colleagues waved away their failure to include the impact of precipitation changes in their paper with the statement that “Integrated assessment models often assume that other climate variables scale with temperature” (Anthoff, Estrada, and Tol 2016, p. 605. Emphasis added). In plain English, this is the assumption that, if temperature “gets better”, then so does rainfall! Since an AMOC shutdown would counteract global warming for northern Europe and North America, and they are the biggest economies, ipso facto the global economy will improve from losing this fundamental component of the planet’s climate.
This is nonsense: changes in global and local temperatures will cause changes in global and local precipitation, but by no means will they be in the same qualitative direction: a change to a more pleasant local temperature could be accompanied by the region turning into a desert or a swamp from decreased or increased rainfall.
This dissembling language is typical of Neoclassical climate change economics, with the most egregious but effective example being how they state damages as a percentage fall in future GDP.
-
The Shell and Pea Trick of Damages to Future GDP
The biggest damage estimate in this literature comes from Burke et al.’s paper “Global non-linear effect of temperature on economic production”, which asserted that a 4°C increase in global temperature by 2100 would cause future GDP to fall by almost 25%:
unmitigated warming is expected to reshape the global economy by reducing average global incomes roughly 23% by 2100. (Burke, Hsiang, and Miguel 2015, p. 235)
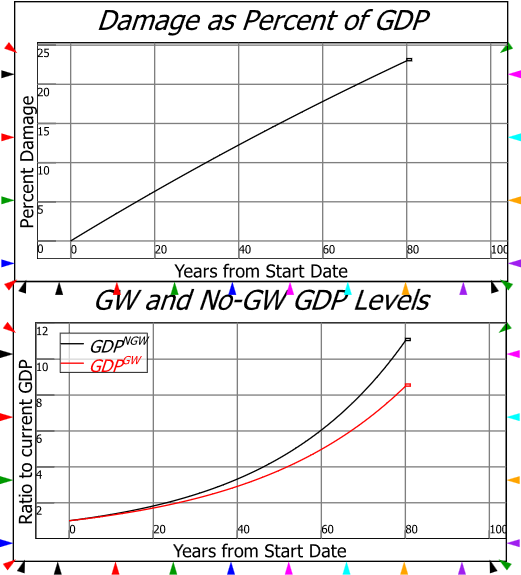
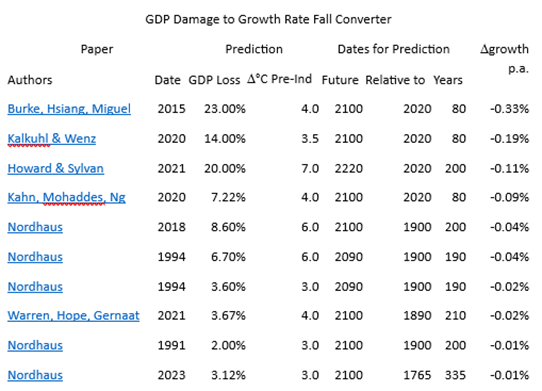
That sounds like a big number, but it implies a trivial fall in the rate of economic growth. If the expected growth rate without global warming was 3% per annum, then this most severe damage prediction in the Neoclassical climate change literature asserts that global warming will reduce the annual rate of economic growth by 0.33% per annum, to 2.67% per year. Therefore, rather than GDP in 2100 being 11 times larger than 2020 in 2020, it will be “only” 8.5 times—see Figure 68.
Figure 68: Burke et al.’s 23% fall in GDP in 2100 graphed against time
The superficially intelligent reaction to this prediction is the one given by Stuart Kirk in his (in)famous speech at the Financial Times conference in 2022 entitled “Why investors need not worry about climate risk”
126F where, in reference to a hypothetical 5% fall in GDP by 2100, he said “who cares, you will never notice”:
Even by the UN IPCC own numbers, climate change will have a negligible effect on the world economy. A (large) temperature rise of 3.6 degrees by 2100 means a loss of 2.6 percent of global GDP. Let’s assume 5%… What they fail to tell everybody of course is between now and 2100 economies are going to grow a lot. At about 2 percent it’s [500%] and about three percent it’s [1000%] … the world is going to be between 500 or 1000 percent richer. If you knock five percent off that in 2100 who cares? You will never notice.
This is indeed how most politicians, policymakers, journalists, and much of the public, have actually reacted: Kirk is exceptional only for voicing this attitude.
However, the deeply intelligent reaction to these predictions is “why do economists expect such trivial damages from climate change?”. If, rather than predicting “a 23% fall in GDP in 2100” from 4°C of warming, economists said “a 0.33% fall in the annual rate of economic growth”, the triviality of their estimates might have alerted scientists to the fact that economists really don’t understand what climate change is.
The “x% fall in GDP by the year yyyy” predictions of climate economists can be converted into a “change in the annual growth rate of x%” prediction by the simple formula:

Here GDPLoss represents the fall in future GDP predicted by economists (stated as a decimal rather than a percentage), and Years is how far in the future this prediction was with respect to a reference date. Table 18 applies this formula to some of the roughly 40 papers economists have written that have generated fall in future GDP predictions, and converts them into predicted falls in the annual rate of growth. Not one of them implies a decline in GDP from climate change, and many are predictions of a decline in the rate of growth which is below the 0.1% per year accuracy with which actual GDP growth is measured today.
Table 18: Some economic damage estimates converted into predicted fall in annual growth rate
These figures explain why one of Nordhaus’ respondents to his 1994 survey of “experts” remarked that:
“I am impressed with the view that it takes a very sharp pencil to see the difference between the world with and without climate change or with and without mitigation.” (Nordhaus 1994b, p. 48)
Conclusion
The only explanation for how bad this work by Neoclassical climate change economists has been is the methodological topic covered in the previous chapter: consciously or otherwise, Neoclassical economists respond to a perceived attack on their paradigm by making domain assumptions that appear reasonable to them, but are insane from any outsider’s perspective. The paradigm is preserved, at the expense, when these crazy assumptions affect government policy, of harming the economy itself.
In the past, as with the Global Financial Crisis, this has simply meant that economists have blinded policymakers to economic events like the Great Depression and the Global Financial Crisis, where a corrective action by governments could ultimately attenuate the damage. But with Global Warming, their defence of their paradigm will in all likelihood put capitalism into an existential crisis. The damages from climate change will be far, far greater than economists have told policymakers they will be, and the remedies are not relatively simple economic policies like The New Deal, but engineering feats that humanity has never managed in the past, and which may be too little, too late, against the enormous forces of a perturbed climate.
Therefore, Neoclassical economics is not merely an inappropriate paradigm for the analysis of capitalism, but a deluded manner of thinking about capitalism that may end up causing the destruction of capitalism itself.
It has to go.
-
References
Anthoff, David, Francisco Estrada, and Richard S. J. Tol. 2016. ‘Shutting Down the Thermohaline Circulation’, The American Economic Review, 106: 602-06.
Burke, Marshall, Solomon M. Hsiang, and Edward Miguel. 2015. ‘Global non-linear effect of temperature on economic production’, Nature, 527: 235.
Dietz, Simon, James Rising, Thomas Stoerk, and Gernot Wagner. 2021a. ‘Economic impacts of tipping points in the climate system’, Proceedings of the National Academy of Sciences, 118: e2103081118.
———. 2021b. ‘Economic impacts of tipping points in the climate system: supplementary information’, Proceedings of the National Academy of Sciences, 118: e2103081118.
———. 2022. ‘Reply to Keen et al.: Dietz et al. modeling of climate tipping points is informative even if estimates are a probable lower bound’, Proceedings of the National Academy of Sciences, 119: e2201191119.
Drótos, Gábor, Tamás Bódai, and Tamás Tél. 2016. ‘Quantifying nonergodicity in nonautonomous dissipative dynamical systems: An application to climate change’, Physical review. E, 94: 022214.
Forrester, Jay W. 1971. World Dynamics (Wright-Allen Press: Cambridge, MA).
———. 1973. World Dynamics (Wright-Allen Press: Cambridge, MA).
Greenaway, D. 1991. ‘Economic Aspects Of Global Warming: Editorial Note’, The Economic journal (London), 101: 902-03.
Hanley, Brian P., and Stephen Keen. 2022. “The Sign of Risk for Present Value of Future Losses.” In arXiv.
Hope, Chris, John Anderson, and Paul Wenman. 1993. ‘Policy analysis of the greenhouse effect: An application of the PAGE model’, Energy Policy, 21: 327-38.
Kahn, Matthew E., Kamiar Mohaddes, Ryan N. C. Ng, M. Hashem Pesaran, Mehdi Raissi, and Jui-Chung Yang. 2021. ‘Long-term macroeconomic effects of climate change: A cross-country analysis’, Energy Economics: 105624.
Keen, S., and Brian P. Hanley. 2023. “Supporting Document to the DICE against pensions: how did we get here?” In. London: Carbon Tracker.
Keen, Steve. 2020. ‘The appallingly bad neoclassical economics of climate change’, Globalizations: 1-29.
Keen, Steve, Timothy Lenton, T. J. Garrett, James W. B. Rae, Brian P. Hanley, and M. Grasselli. 2022. ‘Estimates of economic and environmental damages from tipping points cannot be reconciled with the scientific literature’, Proceedings of the National Academy of Sciences, 119: e2117308119.
Lenton, Timothy, David I. Armstrong McKay, Sina Loriani, Jesse F. Abrams, Steven J. Lade, Jonathan F. Donges, Manjana Milkoreit, Tom Powell, S.R. Smith, Caroline Zimm, J.E. Buxton, Emma Bailey, L. Laybourn, A. Ghadiali, and J.G. Dyke. 2023. “The Global Tipping Points Report 2023 ” In. Exeter, UK.: University of Exeter.
Lenton, Timothy, and Juan-Carlos Ciscar. 2013. ‘Integrating tipping points into climate impact assessments’, Climatic Change, 117: 585-97.
Lenton, Timothy M., Hermann Held, Elmar Kriegler, Jim W. Hall, Wolfgang Lucht, Stefan Rahmstorf, and Hans Joachim Schellnhuber. 2008a. ‘Supplement to Tipping elements in the Earth’s climate system’, Proceedings of the National Academy of Sciences, 105.
———. 2008b. ‘Tipping elements in the Earth’s climate system’, Proceedings of the National Academy of Sciences, 105: 1786-93.
Meadows, Donella H., Jorgen Randers, and Dennis Meadows. 1972. The limits to growth (Signet: New York).
Mendelsohn, Robert, Wendy Morrison, Michael Schlesinger, and Natalia Andronova. 2000. ‘Country-Specific Market Impacts of Climate Change’, Climatic Change, 45: 553-69.
Mendelsohn, Robert, Michael Schlesinger, and Larry Williams. 2000. ‘Comparing impacts across climate models’, Integrated Assessment, 1: 37-48.
Nordhaus, William. 1994a. ‘Expert Opinion on Climate Change’, American Scientist, 82: 45–51.
———. 2008. ‘Results of the DICE-2007 Model Runs.’ in, A Question of Balance (Yale University Press).
———. 2013. The Climate Casino: Risk, Uncertainty, and Economics for a Warming World (Yale University Press: New Haven, CT).
———. 2018. ‘Projections and Uncertainties about Climate Change in an Era of Minimal Climate Policies’, American Economic Journal: Economic Policy, 10: 333–60.
Nordhaus, William D. 1973. ‘World Dynamics: Measurement Without Data’, The Economic Journal, 83: 1156-83.
———. 1991. ‘To Slow or Not to Slow: The Economics of The Greenhouse Effect’, The Economic Journal, 101: 920-37.
———. 1992a. ‘Lethal Model 2: The Limits to Growth Revisited’, Brookings Papers on Economic Activity: 1-43.
———. 1992b. ‘An Optimal Transition Path for Controlling Greenhouse Gases’, Science, 258: 1315-19.
———. 1993a. ‘Reflections on the Economics of Climate Change’, The Journal of Economic Perspectives, 7: 11-25.
———. 1993b. ‘Rolling the ‘DICE’: an optimal transition path for controlling greenhouse gases’, Resource and Energy Economics, 15: 27-50.
———. 1994b. ‘Expert Opinion on Climatic Change’, American Scientist, 82: 45-51.
———. 2017a. ‘Revisiting the social cost of carbon’, Proceedings of the National Academy of Sciences, 114: 1518-23.
———. 2017b. ‘Revisiting the social cost of carbon Supporting Information’, Proceedings of the National Academy of Sciences, 114: 1-2.
Nordhaus, William D., and Lint Barrage. 2023. “Policies, Projections, And The Social Cost Of Carbon: Results From The Dice-2023 Model.” In. Cambridge, MA: National Bureau Of Economic Research.
Nordhaus, William D., and Joseph G. Boyer. 1999. ‘Requiem for Kyoto: An Economic Analysis of the Kyoto Protocol’, The Energy Journal, 20: 93-130.
Nordhaus, William D., and Andrew Moffat. 2017. “A Survey Of Global Impacts Of Climate Change: Replication, Survey Methods, And A Statistical Analysis.” In. New Haven, Connecticut: Cowles Foundation.
Nordhaus, William, and Paul Sztorc. 2013. “DICE 2013R: Introduction and User’s Manual.” In.
OECD. 2021. Managing Climate Risks, Facing up to Losses and Damages.
Offer, Avner, and Gabriel Söderberg. 2016. The Nobel Factor: The Prize in Economics, Social Democracy, and the Market Turn (Princeton University Press: New York).
Peters, Ole. 2019. ‘The ergodicity problem in economics’, Nature Physics, 15: 1216-21.
Pindyck, Robert S. 2017. ‘The Use and Misuse of Models for Climate Policy’, Review of Environmental Economics and Policy, 11: 100-14.
Piontek, Franziska, Laurent Drouet, Johannes Emmerling, Tom Kompas, Aurélie Méjean, Christian Otto, James Rising, Bjoern Soergel, Nicolas Taconet, and Massimo Tavoni. 2021. ‘Integrated perspective on translating biophysical to economic impacts of climate change’, Nature Climate Change, 11: 563-72.
Ramsey, F. P. 1928. ‘A Mathematical Theory of Saving’, The Economic Journal, 38: 543-59.
Solow, R. M. 2010. “Building a Science of Economics for the Real World.” In House Committee on Science and Technology Subcommittee on Investigations and Oversight. Washington.
Stanton, Elizabeth A., Frank Ackerman, and Sivan Kartha. 2009. ‘Inside the integrated assessment models: Four issues in climate economics’, Climate and Development, 1: 166-84.
Tol, R. S. J. 1995. ‘The damage costs of climate change toward more comprehensive calculations’, Environmental and Resource Economics, 5: 353-74.
Tol, Richard S. J. 2009. ‘The Economic Effects of Climate Change’, The Journal of Economic Perspectives, 23: 29–51.
Vellinga, Michael, and Richard A. Wood. 2008. ‘Impacts of thermohaline circulation shutdown in the twenty-first century: Abrupt Climate Change Near the Poles’, Climatic Change, 91: 43-63.
Weitzman, Martin L. 2012. ‘GHG Targets as Insurance Against Catastrophic Climate Damages’, Journal of Public Economic Theory, 14: 221-44.
Excellent. Typo alert: you probably mean ‘anodyne’ not ‘androgynous’.
Thanks. Androgynous was appropriate, but anodyne is better. I’ve changed it on Patreon and Substack.